
Mercier–Hochelaga-Maisonneuve in Q3 2026: Sales Down 34%, Supply Up 24%
In Mercier–Hochelaga-Maisonneuve, 205 properties sold in Q3 2026 (-34%) while supply rose 24%. Condos, plexes, houses: median prices, time to sell and what it means for sellers and buyers.
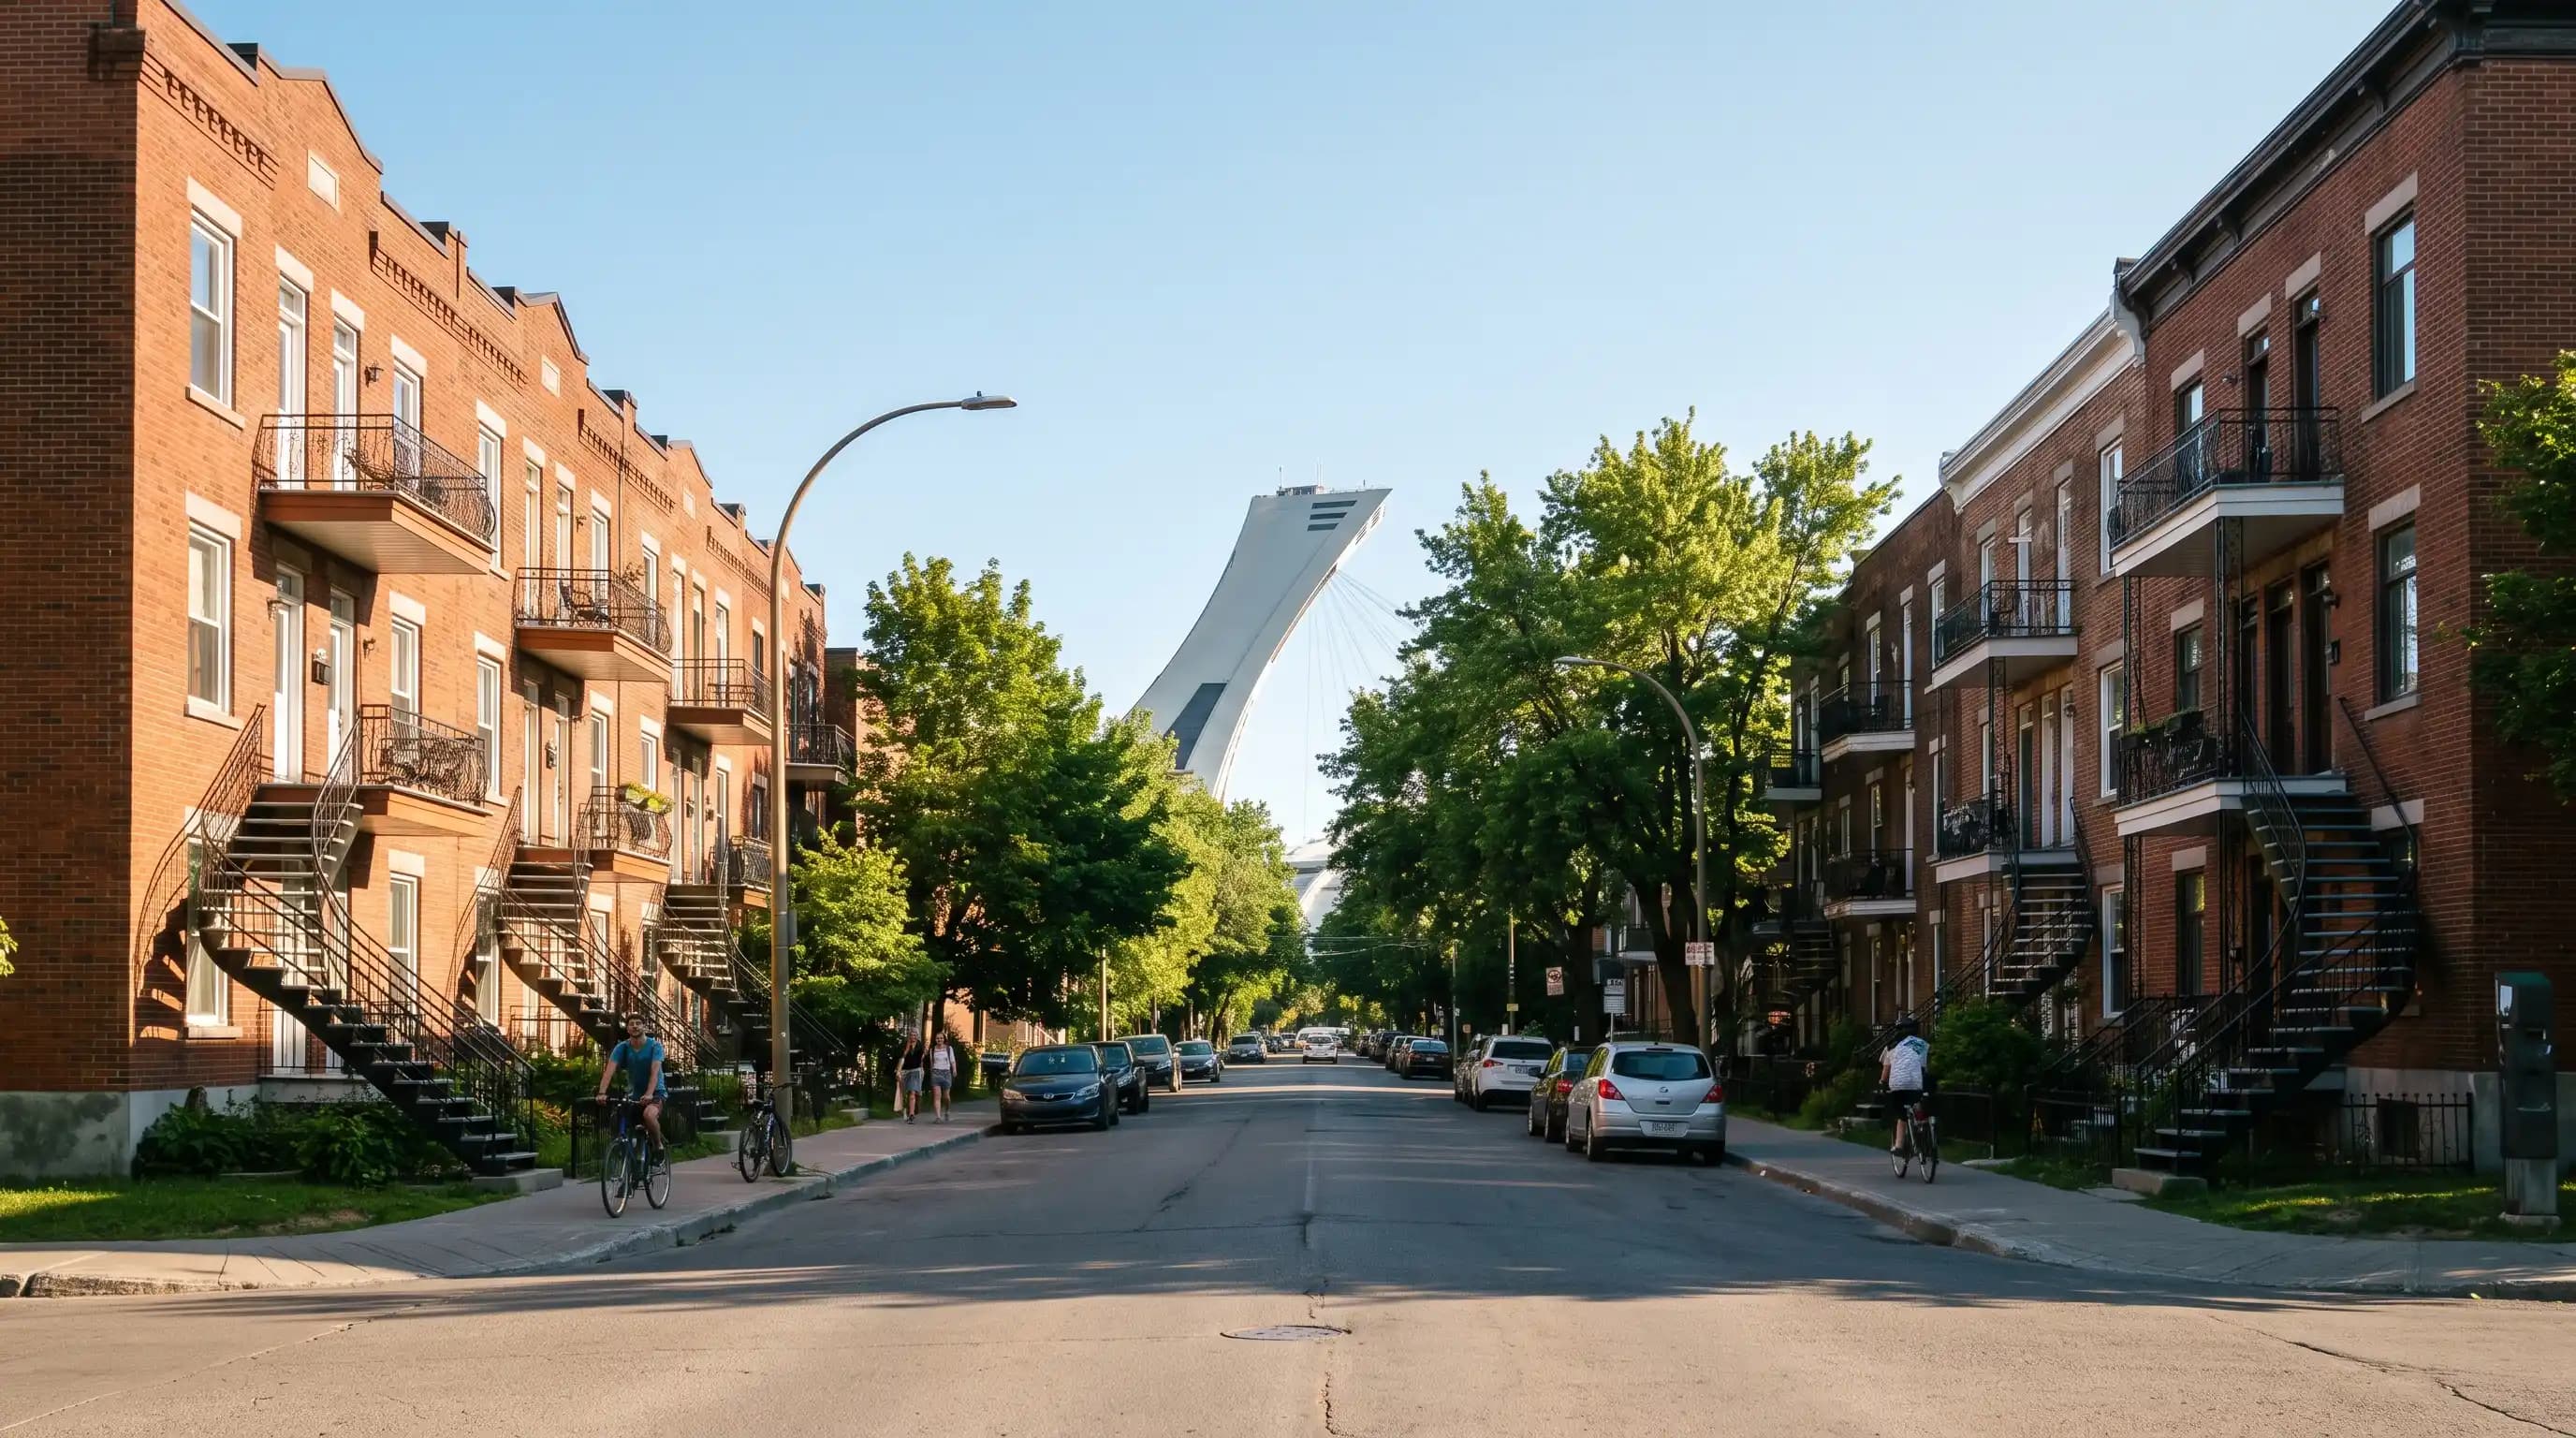
Mercier–Hochelaga-Maisonneuve is one of the most affordable areas our team follows. In Q3 2026, it is also where sales fell the most: -34% year over year, the steepest drop among our 13 areas. Here is what the Centris data for the borough show, property type by property type.
At a glance
- 205 residential properties sold in the borough in Q3 2026, -34% year over year (1,188 sales over the last four quarters, -12%).
- Supply is rising: 545 active listings (+24%), including 297 condos (+32%).
- Condos: 103 sales (-38%), median price of $415,000 (-3%), sold in 43 days on average (+9 days).
- Plexes: 77 sales (-23%), median price steady at $800,000, but 65 days on average to sell (+9 days).
- Single-family homes: 25 sales in the quarter; over four quarters, a median price of $619,625 (steady) and 34 days on average.
- 205
- sales in Q3 2026 (-34%)
- +24%
- active listings (545)
- $415,000
- median condo price (-3%)
- $800,000
- median plex price (steady)
Fewer sales, more supply
In Q3 2026, 205 sales closed in Mercier–Hochelaga-Maisonneuve, 34% fewer than in the same quarter of 2025. Sales volume reached $125.7 million (-32%). New listings were almost flat (499, -1%): with fewer sales, active listings rose to 545 properties (+24%).
Condos: half of all sales, and the fastest-growing supply
Condos made up half of the quarter's sales (103 of 205). Their sales fell 38%, while active listings rose 32% (297 condos). The median price, $415,000, edged down (-3%); over the last four quarters, it stands at $425,125 (+2%).
A condo sells in 43 days on average (+9 days). That is longer than a year ago, but still one of the shortest times among our areas: only Rosemont–La Petite-Patrie does better (40 days).
Plexes: a steady price, a longer time to sell
77 plexes sold in the quarter (-23%), at a median price of $800,000, unchanged year over year. Over the last four quarters, the median price reached $824,750 (+3%) and sales were flat (401). It is the lowest quarterly median plex price among our Montréal-island areas for which Centris publishes this figure.
Selling takes longer, though: 65 days on average (+9 days), compared with 49 days over the last four quarters. With 194 plexes on the market (+13%), sellers face more competition.
Single-family homes: a small market
Only 25 single-family homes sold this quarter, too few for Centris to publish a quarterly median price. Over the last four quarters, 141 homes sold (-25%), at a median price of $619,625 (steady) and in 34 days on average: the lowest median price among our Montréal-island areas. Active listings stand at 53 homes (+20%).
A few facts about the borough
- The borough has three main neighbourhoods: Hochelaga-Maisonneuve, Mercier-Ouest and Mercier-Est (also known as Tétreaultville).
- It covers 24.5 km² and had 140,411 residents in 2021.
- The metro's Green Line crosses it from east to west, with 9 stations, from Préfontaine to Honoré-Beaugrand.
- The Botanical Garden, the Olympic Stadium and the Biodôme form a recreation and tourism hub in the north of the borough.
If you are selling in Mercier–Hochelaga-Maisonneuve
- Set your price from recent, comparable closed sales in your neighbourhood and for your property type, not from the borough average.
- With 24% more properties on the market, buyers compare more: presentation (photos, floor plans, completed work) matters more than a year ago.
- For a plex, gather the leases, income and expenses from the start: a buyer who has these documents in hand decides faster.
- Plan for a realistic timeline: 43 days on average for a condo and 65 days for a plex in Q3.
For a reading of your property, our team prepares a valuation based on real comparable sales. You can start it online or call us at 514-700-1221.
If you are buying in Mercier–Hochelaga-Maisonneuve
- You have more choice than a year ago, especially for condos (297 on the market, +32%): take the time to compare before making an offer.
- For a condo, read the syndicate's documents: financial statements, contingency fund and meeting minutes.
- For a plex, look beyond the price: actual income, operating expenses, the building's condition and obligations to tenants.
- Get pre-approved before you search: you will know what budget to aim for, and your offer will be more credible.
Frequently asked questions
What is the median condo price in Mercier–Hochelaga-Maisonneuve?
In Q3 2026, the median price of a condo sold in the borough is $415,000 (-3% year over year), according to Centris. Over the last four quarters, it is $425,125. It is a market benchmark, not the value of a specific property.
How long does it take to sell a plex in Mercier–Hochelaga-Maisonneuve?
The average time to sell a plex is 65 days in Q3 2026 (+9 days year over year) and 49 days over the last four quarters (Centris). It is an average, not a promise for your property.
Is it a good time to buy in Hochelaga?
Buyers have more choice than a year ago: fewer sales (-34%), more supply (+24%) and steady median prices. The right time still depends on your budget, your financing and the property you want, not only on the market.
Sources, method and limits
Sources: Centris public statistics for the Mercier–Hochelaga-Maisonneuve geographic division, extracted on October 2, 2026; public facts: Wikipedia (French article on the Mercier–Hochelaga-Maisonneuve borough, consulted on November 4, 2026). Written by Équipe Lefrançois.
Limits: Centris statistics cover the whole borough (Hochelaga-Maisonneuve, Mercier-Ouest and Mercier-Est) and do not break down by neighbourhood. The "average time to sell" is an average number of days on the market, not a median. A single quarter rests on a small number of sales, especially for single-family homes: four-quarter totals are more stable. Comparisons cover the 13 areas for which our team follows Centris statistics.

Need help interpreting the market for your project?
Our team can help you understand what this data actually means for your project.
Related content
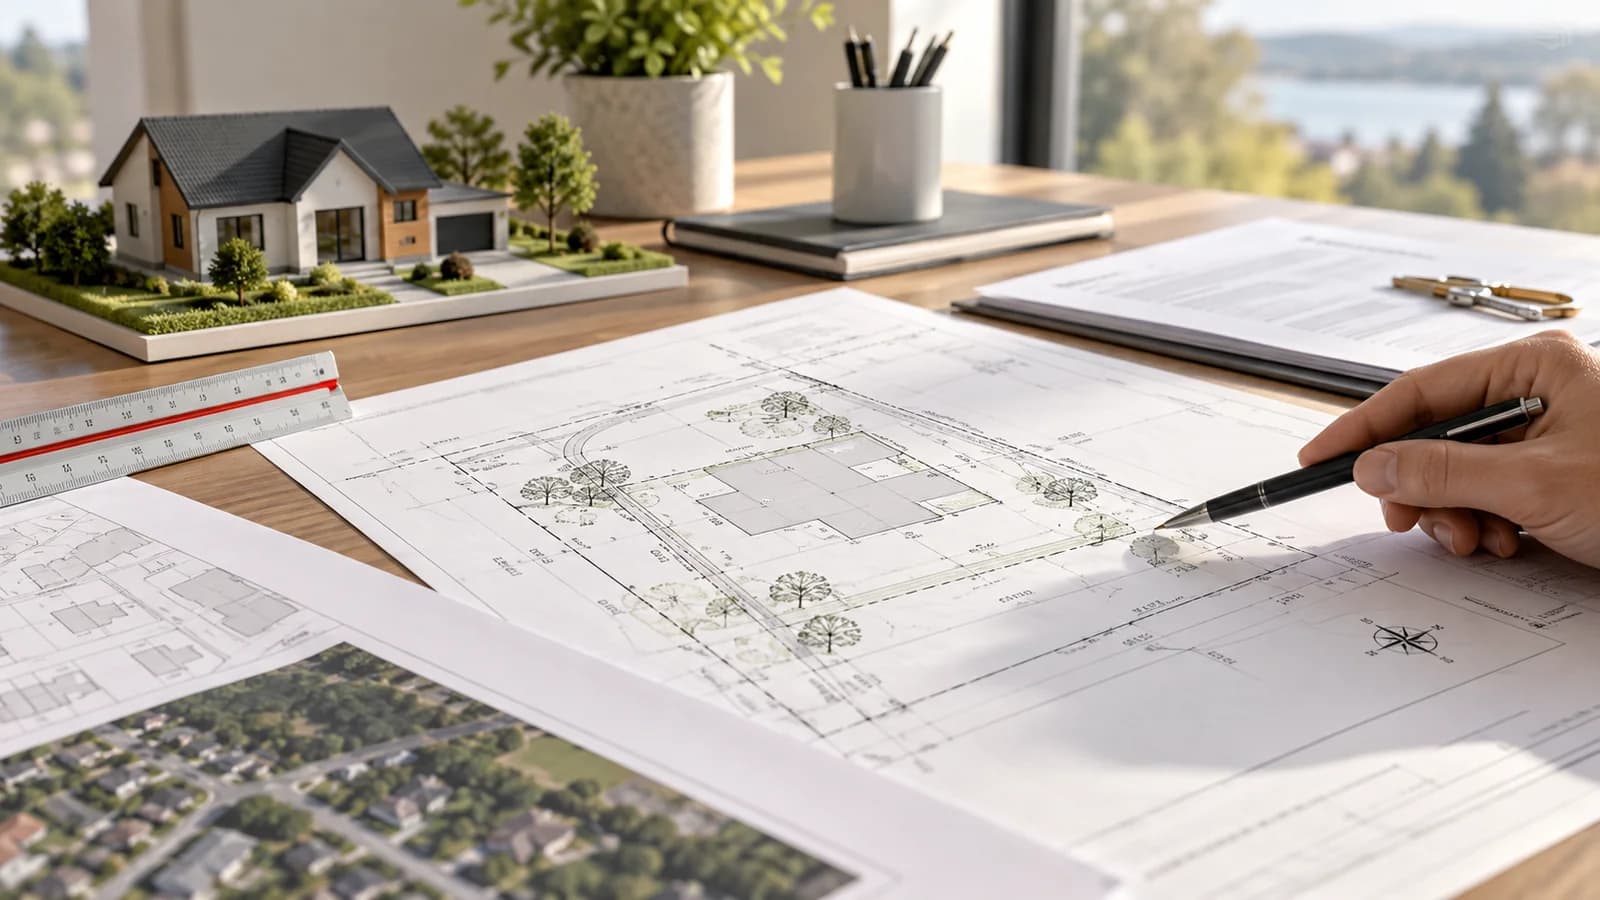
Certificate of Location in Quebec: What It Is, When to Renew It and What It Costs
Contents, the 10-year rule, changes that require a new certificate and the 2026 suggested fee: what sellers and buyers need to know, according to Quebec's land surveyors.
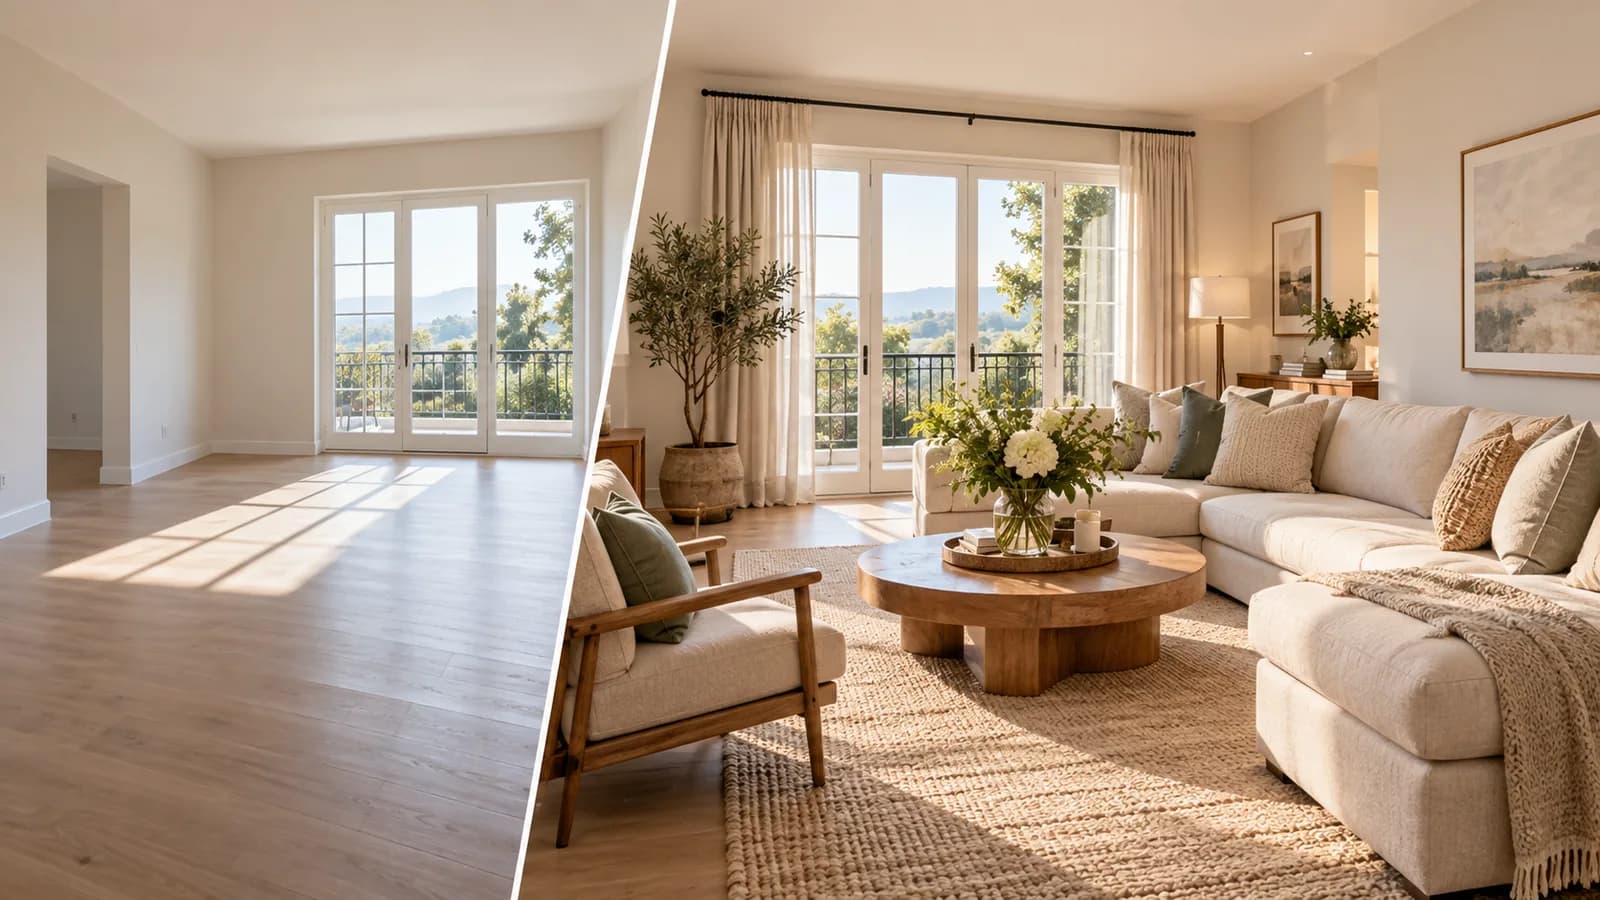
Home Staging: Preparing Your Home for Sale in Montreal, Room by Room
Declutter, depersonalize, repair, light it up: the home staging steps, room by room, and what staging does not replace, before you list your property.

Municipal Assessment vs Market Value: Why They Differ in Montreal
The 2026-2028 roll reflects the market as of July 1, 2024. What each value measures, why the gap can be large and when to request a review.