
Montreal Condos in Q3 2026: Longer Times to Sell, a Market Near Balance
According to QPAREB, condo sales are down 16% in the CMA and take 61 days to sell (+13). Where supply climbs most, where times to sell are getting longer, and what to check before buying or selling.
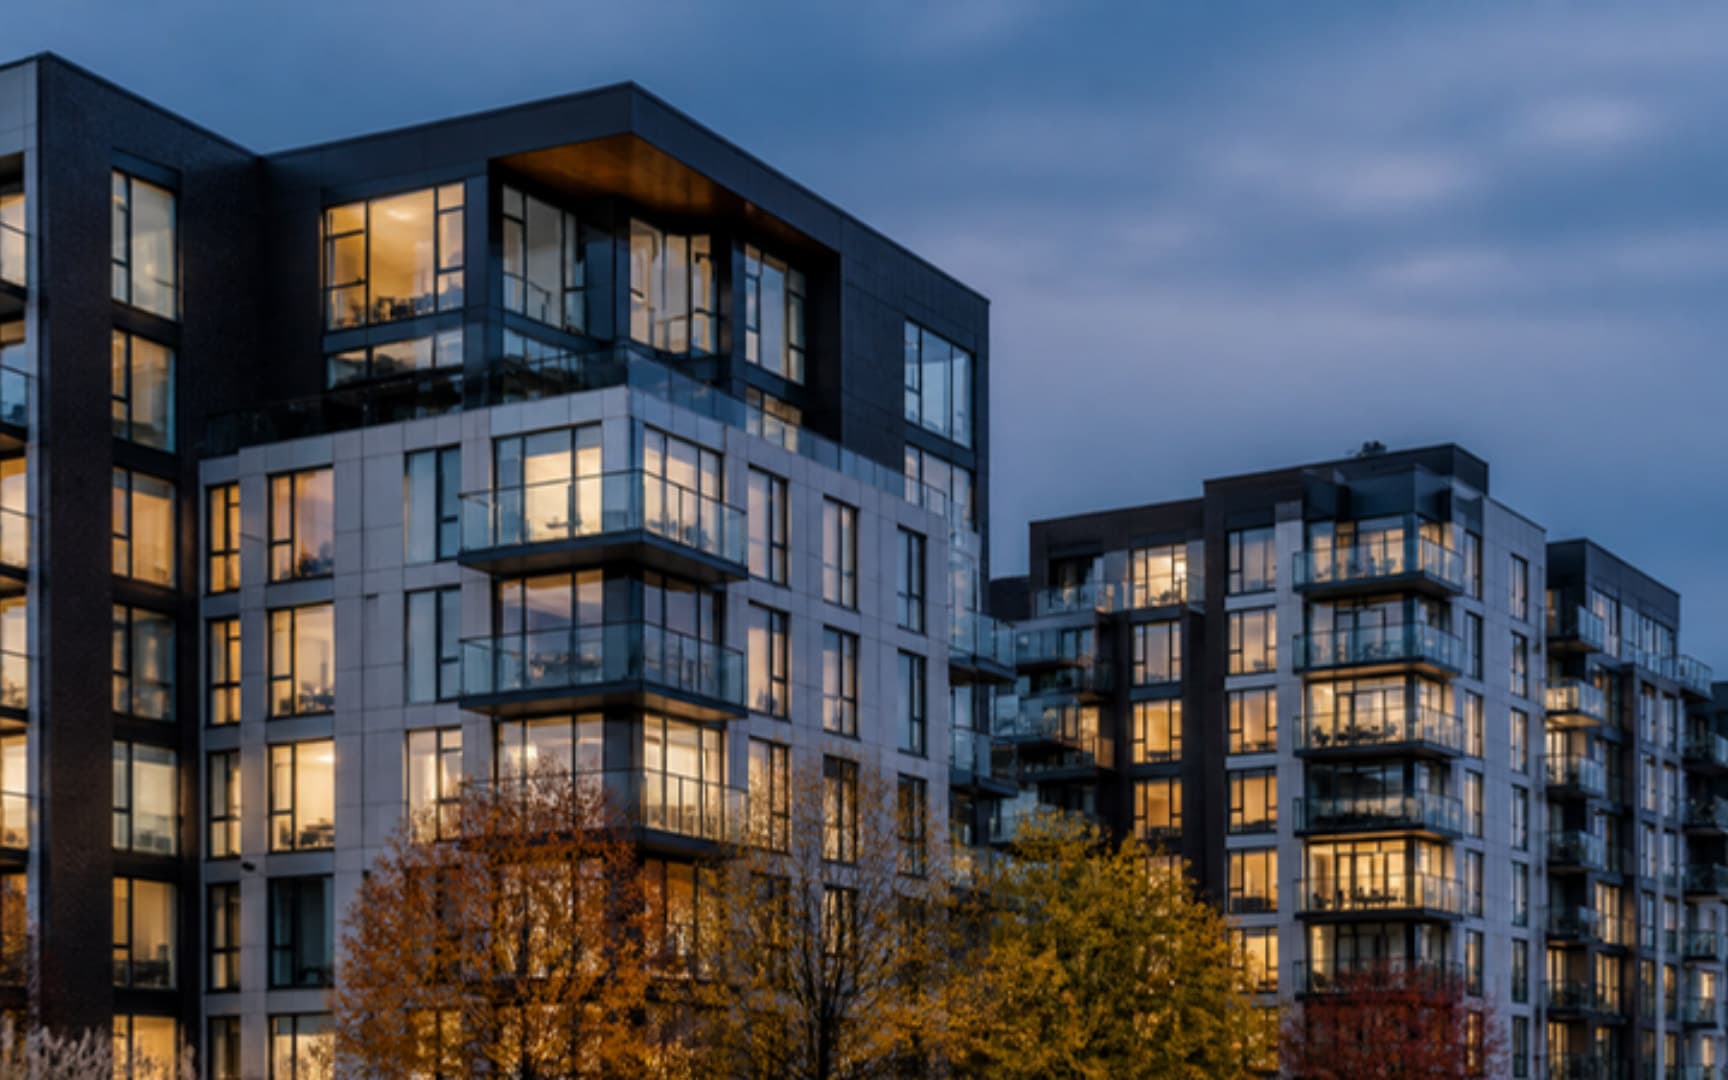
Condos are the segment where the rebalancing of the Montreal market is most advanced. In Q3 2026, their sales are falling faster than those of houses and their time to sell is getting longer. Here is what QPAREB and our areas show, and what to check before buying or selling a condo.
In brief
- In the Montreal CMA, condo sales are down 16% in Q3 2026 (QPAREB).
- They take 61 days to sell on average, 13 days more than a year earlier, versus 40 days for single-family homes.
- The median condo price is $435,000 (+2%): prices are holding, it is mostly the time to sell that is getting longer.
- According to QPAREB, the Island of Montreal sits on the threshold between a balanced market and a buyers' market for condos.
- Condo supply is rising in 12 of our 13 areas and flat in Ville-Marie.
- -16%
- CMA condo sales, Q3 2026
- 61 days
- average time to sell a condo in the CMA (+13 days)
- $435,000
- median condo price in the CMA (+2%)
- 92 days
- average time to sell a condo in Ville-Marie (+8 days)
- 75 days
- average time to sell a condo in Saint-Laurent (+22 days)
- +46%
- condo listings in Ahuntsic–Cartierville
What QPAREB says
For Q3, QPAREB reports that condo sales in the Montreal CMA are down 16%, more than single-family sales (-7%). The median price still rises 2%, to $435,000, and the average time to sell goes up to 61 days (+13 days).
The rebalancing varies by territory: the Island of Montreal sits on the threshold between a balanced market and a buyers' market; Laval and Vaudreuil-Soulanges are approaching balance; the North Shore and South Shore still favour sellers. In its August release, QPAREB had already noted that condos on the Island are the segment where the rebalancing process is most advanced.
What our areas show (Centris, Q3 2026)
The longest times to sell a condo
- Ville-Marie : 92 days (+8 days sur un an)
- Saint-Laurent : 75 days (+22 days sur un an)
- Notre-Dame-de-Grâce : 71 days (+13 days sur un an)
- Griffintown (Sud-Ouest borough) : 69 days (+17 days sur un an)
Where times are getting longer fastest
Over one year, the biggest increases in the average time to sell a condo:
- Saint-Laurent : 75 days (+22 days sur un an)
- Griffintown (Sud-Ouest borough) : 69 days (+17 days sur un an)
- Notre-Dame-de-Grâce : 71 days (+13 days sur un an)
One area is the exception: in Ahuntsic–Cartierville, the average time to sell a condo is getting shorter (52 days, -6 days year over year).
Where condo supply is climbing most
- Ahuntsic–Cartierville : 229 condo listings, +46%
- Montérégie : 1,992 condo listings, +38%
- Rosemont–La Petite-Patrie : 240 condo listings, +37%
- Mercier–Hochelaga-Maisonneuve : 297 condo listings, +32%
- Plateau–Mont-Royal : 364 condo listings, +30%
In Ville-Marie, condo supply is flat (2,203 active listings, 0%), yet the time to sell there is the longest of our areas. On the sales side, only Notre-Dame-de-Grâce (+4%) and Saint-Laurent (+6%) have more condo sales than a year earlier.
If you are buying a condo
- More choice and longer times to sell give you time to compare: visit several similar units before making up your mind.
- Before comparing prices, compare buildings: condo fees, the state of the contingency fund, meeting minutes, financial statements and the maintenance log.
- Support your offer with recent comparable sales in the same building or street rather than a fixed percentage discount.
- Plan your financing: a mortgage pre-approval pins down your real budget and makes your promise to purchase more credible.
If you are selling a condo
- You are competing with more similar units: look at how many comparable listings are active in your building and street.
- Plan a realistic timeline: 61 days is a CMA average, and the gaps between areas are large.
- Prepare the condo documents (declaration of co-ownership, meeting minutes, financial statements, maintenance log and contingency fund study, where they exist) before going to market.
- Set the price using recent completed sales rather than asking prices.
Frequently asked questions
Are condo prices falling in Montreal?
Not overall: according to QPAREB, the median condo price in the CMA is $435,000 in Q3 2026, up 2%. It is mostly sales (-16%) and time to sell (61 days, +13) that reflect the slowdown. Results do vary from one area to another.
Is it a buyers' market for condos?
According to QPAREB, the Island of Montreal sits on the threshold between a balanced market and a buyers' market. Laval and Vaudreuil-Soulanges are approaching balance, while the North Shore and South Shore still favour sellers.
How long does it take to sell a condo?
In the CMA, the average time to sell a condo is 61 days in Q3 2026 (QPAREB). In our areas it ranges from 40 days in Rosemont–La Petite-Patrie to 92 days in Ville-Marie (Centris). That is an average, not a promise.
What should I check before buying a condo?
The building's condo fees, the state of the contingency fund, meeting minutes, financial statements and maintenance log, in addition to the unit's pre-purchase inspection. These documents say a lot about the health of the building.
Sources, method and limits
Sources: QPAREB (known as APCIQ in French) releases of October 14, 2026 (Q3) and September 4, 2026 (August), based on the Centris database; Centris public statistics by area, extracted on October 2, 2026. CMA figures are reproduced as published. Interpretation: Équipe Lefrançois.
Limits: the CMA and our areas do not cover the same territories, and some areas correspond to an entire borough. "Average time to sell" is an average number of days on the market, not a median. Areas where Centris does not publish a reliable quarterly figure for condos (Town of Mount Royal, Outremont) are left out of the time-to-sell rankings. For Villeray, we do not comment on the change in the median condo price (+33%), based on a small sample of 47 sales. These figures are neither a forecast nor financial advice.

Need help interpreting the market for your project?
Our team can help you understand what this data actually means for your project.
Related content
Le Plateau–Mont-Royal in Q3 2026: $1,200,000 Plexes, 76 Days to Sell, More Condos (+30%)
In Le Plateau–Mont-Royal, the median plex price reaches $1,200,000 (+4%) but takes 76 days to sell, and condo supply climbs 30%. What it changes for selling or buying.

Ahuntsic–Cartierville in Q3 2026: Plex Sales Jump 54%, Condo Sales Fall 30%
In Ahuntsic–Cartierville, 71 plexes sold in Q3 2026 (+54%), at a median price of $935,000, while supply jumps 40%. What it changes for selling or buying.

Downtown Montreal Condos in Q3 2026: 92 Days in Ville-Marie, 69 Days in Griffintown
In downtown Montreal, a condo takes 92 days to sell in Ville-Marie (+8) and 69 days in Griffintown (+17), according to Centris. Median prices, supply and area landmarks.