
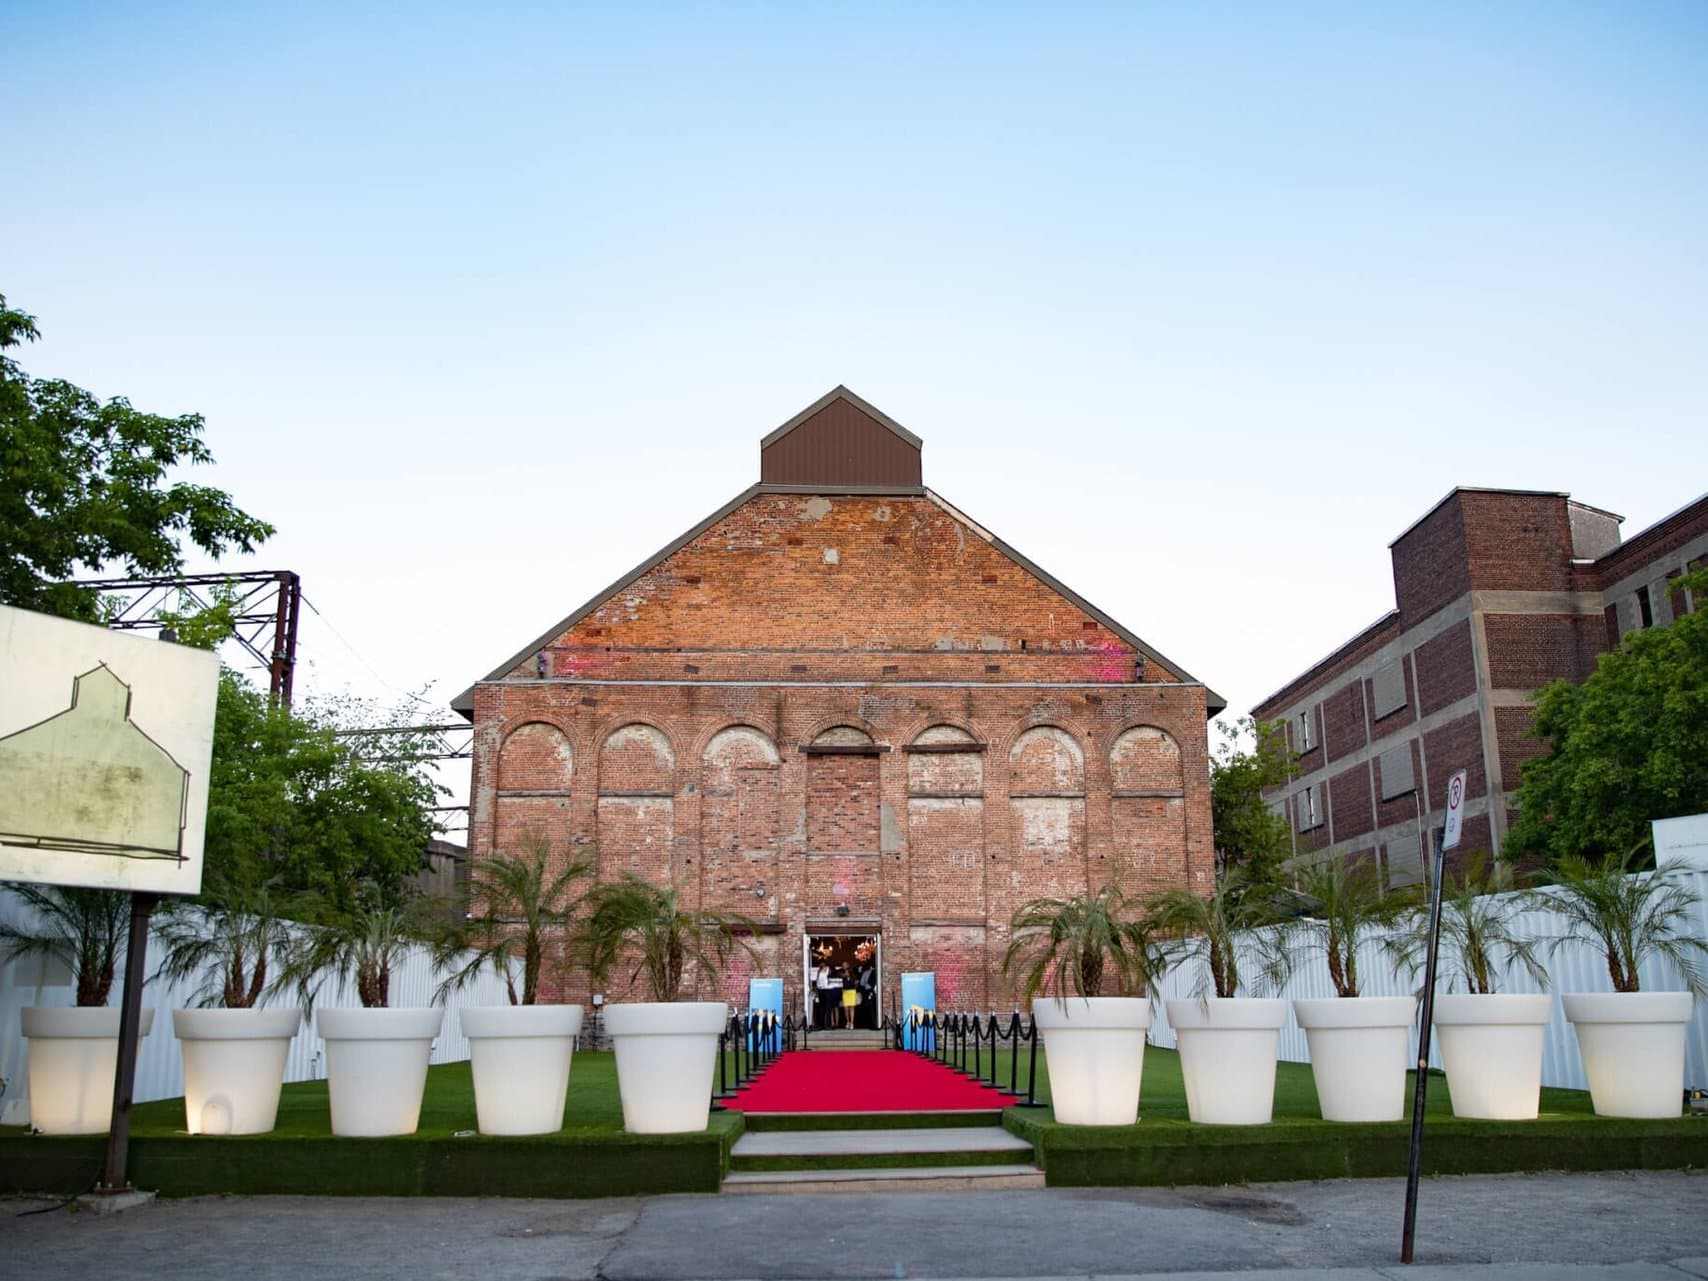
Photo: Guillaume Hébert-Jodoin, CC BY-SA 3.0, via Wikimedia Commons
Your real estate brokerin Montérégie
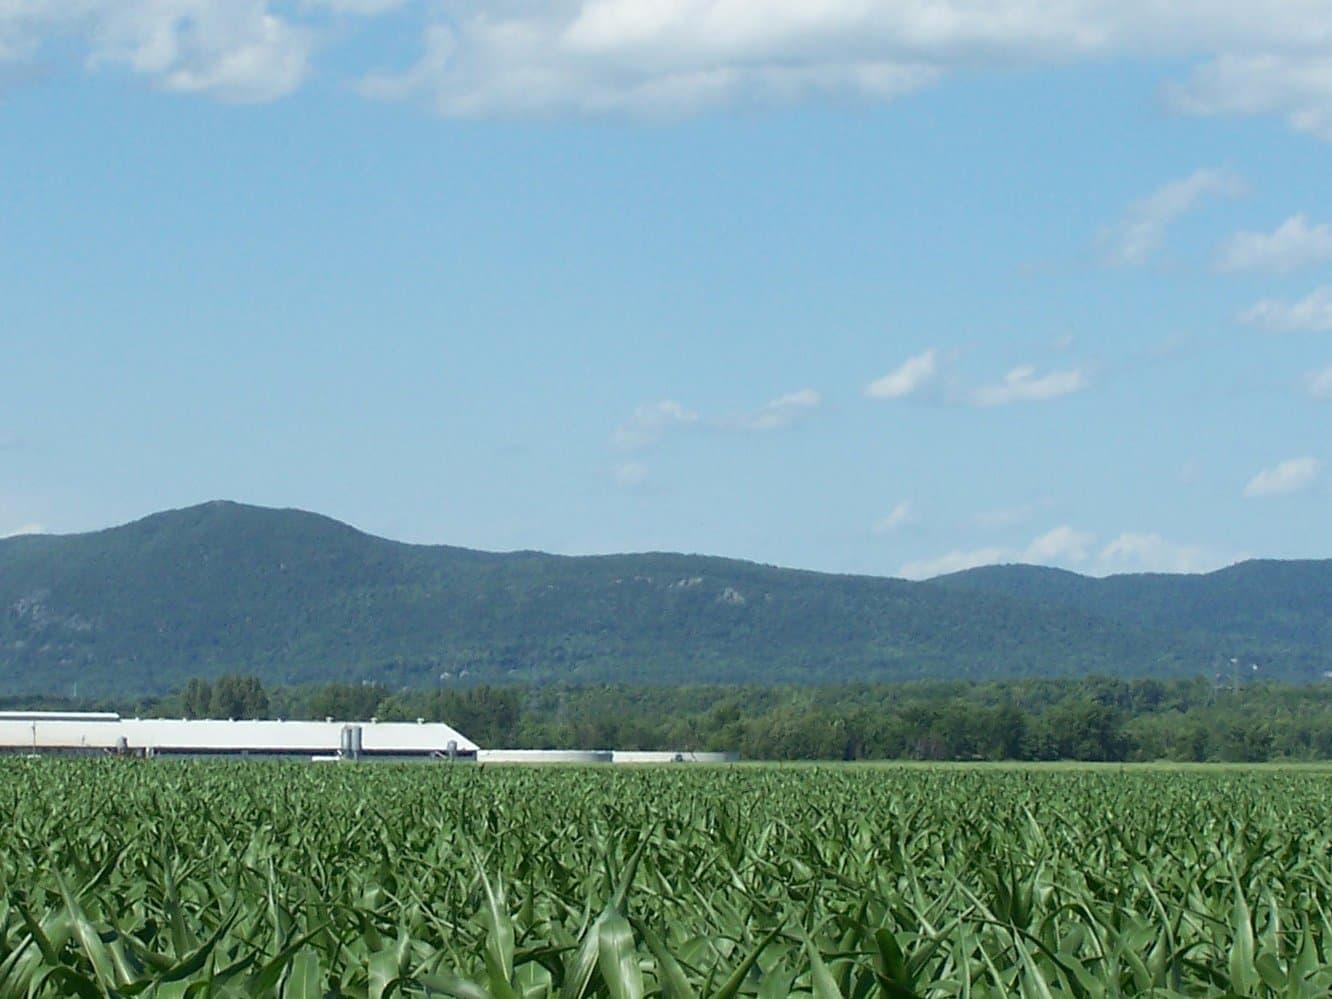
Montérégie is a vast administrative region south of Montreal, made up of many distinct municipalities on both sides of the St. Lawrence River.
Montérégie market insights
A regional market where sales are falling while supply grows sharply, with slightly higher median prices across every property type — figures that mask significant variation from one municipality to another.
Q3 2026 market snapshot
These figures should be interpreted in light of the property's type, condition, street and particular features — a sector-wide statistic never replaces an individual valuation.
Our reading of the market
In the third quarter of 2026, 3,851 residential properties sold in Montérégie, a 10% decline from the same quarter last year (-6% over the trailing four quarters). New listings grew 12% and active listings 22% for the quarter, a sign of growing supply region-wide. Median prices are slightly higher year over year: $589,600 for single-family homes (+1%), $396,000 for condominiums (+2%) and $684,500 for plexes (+4%). Condominiums are the property type hit hardest by the sales decline (-16%, with an average time on market of 52 days, +11 days). These figures cover the entire region and mask significant variation from one municipality to another — never a substitute for an analysis specific to your municipality.
- 3,851-10% vs Q3 2025Sales completedQ3 2026
- 7,097+12% vs Q3 2025New listingsQ3 2026
- 7,142+22% vs Q3 2025Active listingsQ3 2026
- $2.3B-7% vs Q3 2025Sales volumeQ3 2026
- 17,961-6% vs the 4 quarters ending Q3 2025Sales completedTrailing 4 quarters
- 28,623+6% vs the 4 quarters ending Q3 2025New listingsTrailing 4 quarters
- 6,519+10% vs the 4 quarters ending Q3 2025Active listingsTrailing 4 quarters
- $10.7B-1% vs the 4 quarters ending Q3 2025Sales volumeTrailing 4 quarters
Number of transactions completed during the period — the sample size behind the other indicators.
Number of new active listings during the period.
Number of properties actively listed for sale at the end of the period — available supply, distinct from new listings.
Total value of all transactions completed during the period.
Compiled by Équipe Lefrançois from Centris data, extracted on October 2, 2026. Single-family homes, condominiums and plexes (2 to 5 units) — Montérégie. Period analyzed: Q3 2026.
- 2,664-7% vs Q3 2025Sales completedQ3 2026
- 4,395+16% vs Q3 2025Active listingsQ3 2026
- $589,600+1% vs Q3 2025Median sale priceQ3 2026
- 41 days+1 days vs Q3 2025Average days on marketQ3 2026
- 12,154-5% vs the 4 quarters ending Q3 2025Sales completedTrailing 4 quarters
- 4,093+5% vs the 4 quarters ending Q3 2025Active listingsTrailing 4 quarters
- $588,650+4% vs the 4 quarters ending Q3 2025Median sale priceTrailing 4 quarters
- 38 days-7 days vs the 4 quarters ending Q3 2025Average days on marketTrailing 4 quarters
Number of transactions completed during the period — the sample size behind the other indicators.
Number of properties actively listed for sale at the end of the period — available supply, distinct from new listings.
The price at which half of sold properties sold for more, and half for less — a measure less sensitive to extreme values than an average, never to be confused with a municipal property assessment.
Average number of days between listing and a completed sale.
Compiled by Équipe Lefrançois from Centris data, extracted on October 2, 2026. Single-family homes — Montérégie. Period analyzed: Q3 2026.
- 902-16% vs Q3 2025Sales completedQ3 2026
- 1,992+38% vs Q3 2025Active listingsQ3 2026
- $396,000+2% vs Q3 2025Median sale priceQ3 2026
- 52 days+11 days vs Q3 2025Average days on marketQ3 2026
- 4,515-8% vs the 4 quarters ending Q3 2025Sales completedTrailing 4 quarters
- 1,765+25% vs the 4 quarters ending Q3 2025Active listingsTrailing 4 quarters
- $394,234+3% vs the 4 quarters ending Q3 2025Median sale priceTrailing 4 quarters
- 46 days+4 days vs the 4 quarters ending Q3 2025Average days on marketTrailing 4 quarters
Number of transactions completed during the period — the sample size behind the other indicators.
Number of properties actively listed for sale at the end of the period — available supply, distinct from new listings.
The price at which half of sold properties sold for more, and half for less — a measure less sensitive to extreme values than an average, never to be confused with a municipal property assessment.
Average number of days between listing and a completed sale.
Compiled by Équipe Lefrançois from Centris data, extracted on October 2, 2026. Condominiums — Montérégie. Period analyzed: Q3 2026.
- 274-8% vs Q3 2025Sales completedQ3 2026
- 640+26% vs Q3 2025Active listingsQ3 2026
- $684,500+4% vs Q3 2025Median sale priceQ3 2026
- 49 days-10 days vs Q3 2025Average days on marketQ3 2026
- 1,233-5% vs the 4 quarters ending Q3 2025Sales completedTrailing 4 quarters
- 562+3% vs the 4 quarters ending Q3 2025Active listingsTrailing 4 quarters
- $687,250+10% vs the 4 quarters ending Q3 2025Median sale priceTrailing 4 quarters
- 49 days-14 days vs the 4 quarters ending Q3 2025Average days on marketTrailing 4 quarters
Number of transactions completed during the period — the sample size behind the other indicators.
Number of properties actively listed for sale at the end of the period — available supply, distinct from new listings.
The price at which half of sold properties sold for more, and half for less — a measure less sensitive to extreme values than an average, never to be confused with a municipal property assessment.
Average number of days between listing and a completed sale.
Compiled by Équipe Lefrançois from Centris data, extracted on October 2, 2026. Plexes (2 to 5 units) — Montérégie. Period analyzed: Q3 2026.
Looking to sell in Montérégie?
The slight rise in median prices region-wide is a reassuring signal, but with sales down (-10%) and supply up (+22%), pricing strategy should always rely on the real comparables in your municipality, never the regional average.
Get my Montérégie property valuedLooking to buy in Montérégie?
The strong growth in active listings (+22% for the quarter, +38% for condominiums) gives buyers more choice region-wide, with very different markets from one municipality to another.
View properties in MontérégieUnderstanding Montérégie
A region, not a single market
Montérégie is made up of 14 regional county municipalities and more than 150 municipalities, each with its own residential market — no single statistic can represent the region as a whole.
A wide range of settings
The region ranges from Montreal's immediate suburbs, like Longueuil or Brossard, to more rural towns and municipalities near the Ontario, Vermont, and New York State borders.
Municipality-level data coming
This page will be progressively enriched with sub-sectors for each municipality or RCM the team follows, as that data is confirmed.
Neighbourhood essentials
Nearby places
Results provided by Google, not verified by our team.
Places verified by our team
No key place has been confirmed for this area yet.
Sell a property in Montérégie
Selling in Montérégie starts with a market and comparables analysis specific to your municipality — never a regional average, which would represent no real market —, followed by a pricing strategy and preparation suited to your property, then marketing and support through to closing.
Get my Montérégie property valued
Buy in Montérégie
Buying in Montérégie starts with clarifying your criteria, financing, and the municipality you're looking in — the region spans very different markets from one area to another —, then comparing what's available before preparing a suitable offer, with support through to closing.
Speak with a buyer's brokerProperties available in Montérégie
No properties available right now
No active property currently matches the Montérégie sector. New properties may be added regularly.
Property types and reading the area
Every property in Montérégie is analyzed by type, condition, precise municipality, and the comparables truly relevant to that municipality — never a generic regional figure, which would represent no real market.
- Single-family home
- Condo
- Comparables by municipality
Our method in Montérégie
- Analysis — Understanding the data, comparables and positioning specific to Montérégie.
- Strategy — Pricing, preparation and marketing suited to your property.
- Support — Structured follow-up through to signing.
The team behind Montérégie

Marc Lefrançois, CFA
Team Leader Chartered Real Estate Broker, Agency Executive Officer

Chantal Baillargeon
Real Estate Broker

Loris Jean Touffet
Residential Real Estate Broker

François Deslandres
Real Estate Broker

Ming Xi Cui
Residential Real Estate Broker

Jean-Jacques Juliard
Residential Real Estate Broker
Frequently asked questions
Market value depends on comparable sales, location, condition, property features and current market conditions. An online estimate is a starting point; a complete analysis may require a consultation and property visit.
Timing depends on the market as well as your next move, timeline, financing and property condition. A consultation helps compare scenarios instead of relying on seasonality alone.
The process includes market analysis, pricing, preparation recommendations suited to the area's architectural style, marketing assets and launch planning. Exact details are confirmed together in the listing agreement.
Quebec rules strictly govern representation and generally prohibit a residential broker from representing both a buyer and a seller who are each bound by brokerage contracts in the same transaction. A specific situation should be explained in accordance with OACIQ rules.
The team serves Greater Montreal, with an initial strategic and editorial focus on Town of Mount Royal, Outremont, Westmount and central Montreal neighbourhoods.
Ready to know your property's value?
A documented read on your property, its neighbourhood and today's market — no obligation.