
Montérégie in Q3 2026: Supply Up 22%, Median Prices Still Edging Higher
In Montérégie, 3,851 properties sold in Q3 2026 (-10%) while active supply jumps 22%. What these regional figures say, and do not say, to a seller or a buyer.
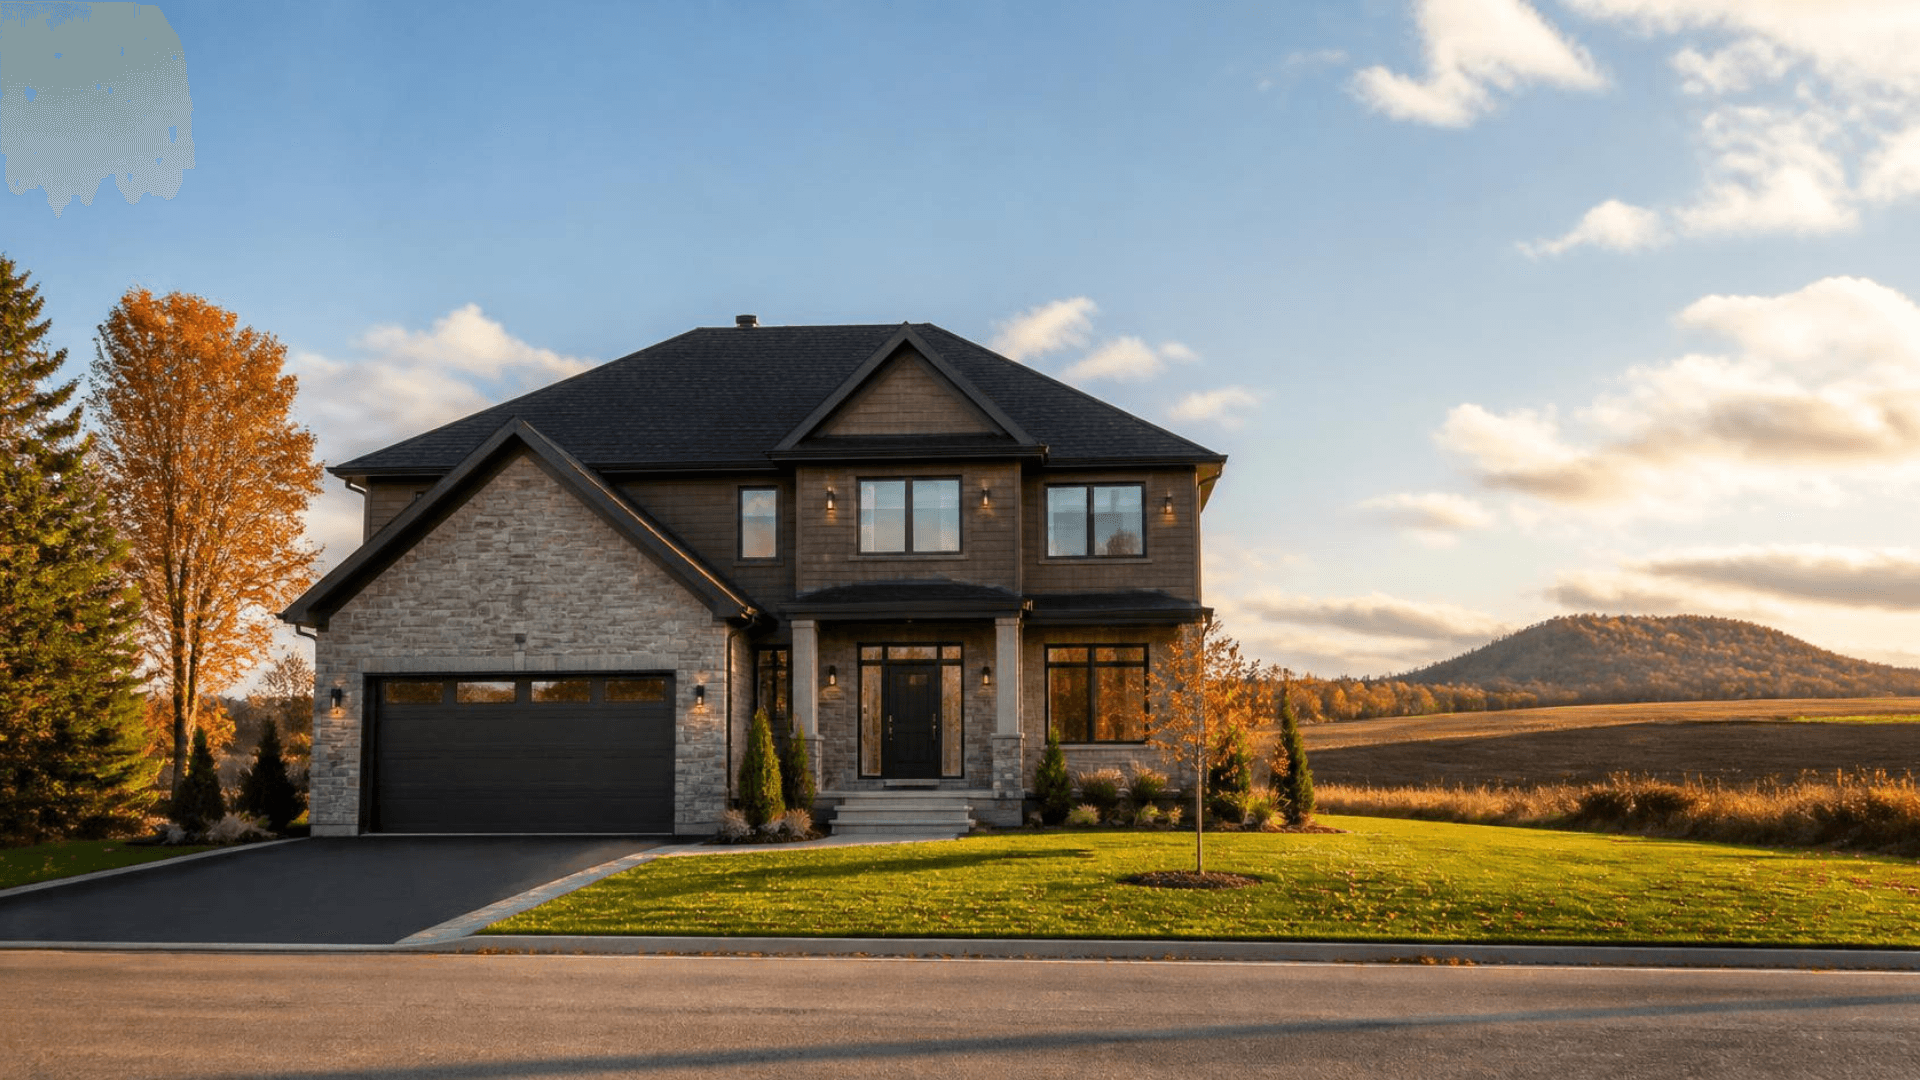
Montérégie is a vast administrative region south of Montreal, made up of many municipalities on both sides of the St. Lawrence River. Centris publishes statistics for the region as a whole. Here is what the third quarter of 2026 (July to September) shows and, above all, how to use the figures without being misled.
In brief
- 3,851 properties sold during the quarter (-10% year over year) and 17,961 over the last four quarters (-6%).
- Supply is climbing: 7,142 active listings (+22%) and 7,097 new listings (+12%).
- Median prices for the quarter: $589,600 for a single-family home (+1%), $396,000 for a condo (+2%) and $684,500 for a plex (+4%).
- Condos are the most affected: sales down 16%, supply up 38%, average time to sell of 52 days (+11 days).
- 3,851
- properties sold in Q3 2026 (-10% year over year)
- 7,142
- active listings in Q3 (+22%)
- $589,600
- median single-family price in Q3 (+1%)
- $396,000
- median condo price in Q3 (+2%)
- $684,500
- median plex price in Q3 (+4%)
- 52 days
- average time to sell a condo in Q3 (+11 days)
More supply, fewer sales, prices holding
Sales are down (3,851 for the quarter, -10%) while supply is growing (7,142 active listings, +22%, and 7,097 new listings, +12%). Sales volume for the quarter reaches $2.3 billion (-7%); over twelve months it reaches $10.7 billion (-1%). Even so, median prices edge up year over year across all three property types. A market where supply grows faster than sales tends to give buyers more room to negotiate, but regional median prices do not show a decline for now.
Three markets, three paces
Single-family homes
2,664 sales for the quarter (-7%) and 12,154 over twelve months (-5%). The median price is $589,600 for the quarter (+1%) and $588,650 over twelve months (+4%). The average time to sell is 41 days for the quarter (+1 day) and 38 days over twelve months (-7 days). Supply is growing: 4,395 active listings (+16%).
Condos
902 sales for the quarter (-16%) and 4,515 over twelve months (-8%). The median price is $396,000 for the quarter (+2%) and $394,234 over twelve months (+3%). The average time to sell is 52 days for the quarter (+11 days) and 46 days over twelve months (+4 days). Supply jumps: 1,992 active listings (+38%). This is the property type where supply climbs the most and where times to sell lengthen the most.
Plexes
274 sales for the quarter (-8%) and 1,233 over twelve months (-5%). The median price is $684,500 for the quarter (+4%) and $687,250 over twelve months (+10%). The average time to sell is 49 days, shorter by 10 days for the quarter and by 14 days over twelve months. Supply is growing: 640 active listings (+26%).
Why a regional average is not enough
Montérégie includes many municipalities with very different markets. A regional median price does not tell you what your house is worth in Longueuil, Brossard or elsewhere: it blends small towns and suburbs, newer and older properties, growing areas and steadier ones. To set a price or prepare an offer, you need comparables: recent sales of similar properties, in your municipality (even your street), of the same type and price range.
- Use the regional median price as a benchmark, never as a starting price.
- Ask for comparable sales from recent months in your municipality, for your property type.
- Watch supply: the gap between new listings and sales for your property type shows the competition you will face.
- For a condo, check the building's financial health before comparing prices.
If you are selling in Montérégie
- Active supply is up 22%: your property will be compared with more listings.
- For a single-family home, the average time stays short (41 days for the quarter, 38 days over twelve months): a right price from the start remains the best strategy.
- For a condo, plan for a longer time to sell (52 days for the quarter, +11 days) and more competition.
If you are buying in Montérégie
- Condo buyers have the most choice: 38% more active listings than a year ago.
- For a single-family home, choice is also growing (+16%), but the median price keeps edging up.
- Compare by municipality before deciding: the same budget does not buy the same thing from one town to the next.
Our team supports sellers and buyers throughout Montérégie. For a reading of your municipality and your property type, call us at 514-700-1221 or start an online valuation.
Frequently asked questions
What is the median price of a house in Montérégie?
According to Centris, the median price of single-family homes sold in Montérégie is $589,600 in Q3 2026 (+1% year over year) and $588,650 over the last four quarters (+4%). It is a regional median price: it varies widely from one municipality to another.
Is the Montérégie real estate market going down?
Sales are down (-10% for the quarter, -6% over twelve months), but median prices edge up across all three property types. A drop in sales is not a drop in prices.
How long does it take to sell a house in Montérégie?
The average time to sell a single-family home is 41 days in Q3 2026 and 38 days over the last four quarters (Centris). For a condo, it is 52 days for the quarter and 46 days over twelve months.
Do these figures apply to the South Shore, Longueuil or Brossard?
They cover the whole Montérégie region, whose municipalities differ greatly. For a specific municipality, you need local comparables.
Sources, method and limits
Source: Centris public statistics for the Montérégie region, extracted on October 2, 2026. Compilation and interpretation: Équipe Lefrançois. Periods: third quarter of 2026 (July to September), compared with the same quarter of 2025, and the last four quarters combined, compared with the previous year's total. Plexes here means buildings of 2 to 5 units.
Limits: "average time to sell" is the average number of days on the market published by Centris, not a median. These figures cover the whole region and hide significant variations from one municipality to another; they do not replace a comparable-sales analysis for a specific property. They are neither a forecast nor financial advice.

Need help interpreting the market for your project?
Our team can help you understand what this data actually means for your project.
Related content
Certificate of Location in Quebec: What It Is, When to Renew It and What It Costs
Contents, the 10-year rule, changes that require a new certificate and the 2026 suggested fee: what sellers and buyers need to know, according to Quebec's land surveyors.
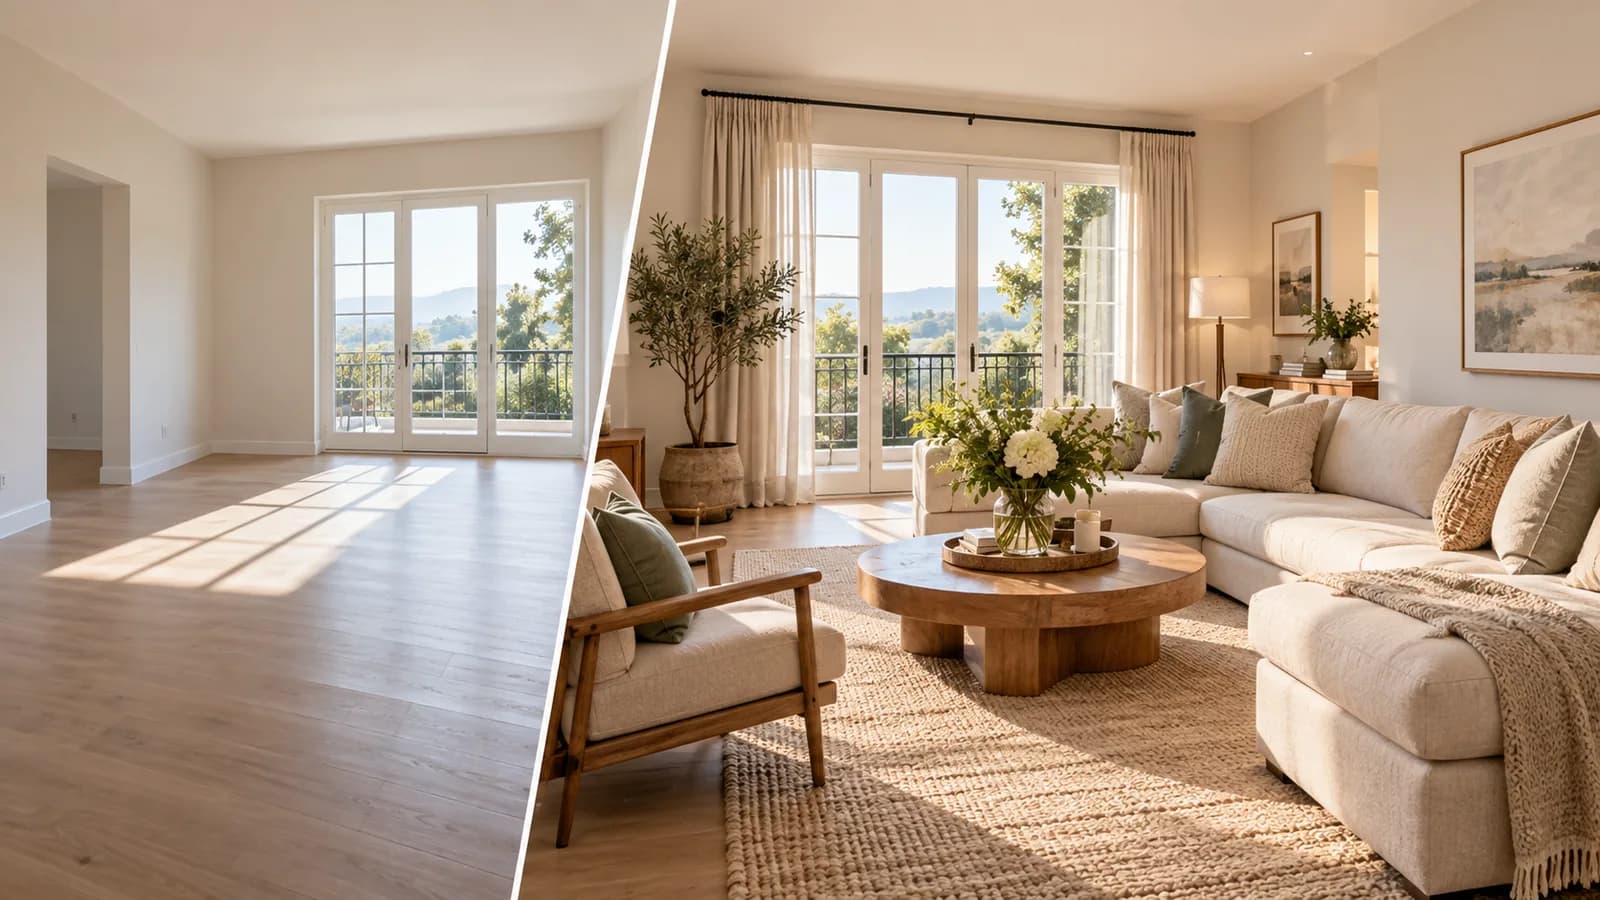
Home Staging: Preparing Your Home for Sale in Montreal, Room by Room
Declutter, depersonalize, repair, light it up: the home staging steps, room by room, and what staging does not replace, before you list your property.

Municipal Assessment vs Market Value: Why They Differ in Montreal
The 2026-2028 roll reflects the market as of July 1, 2024. What each value measures, why the gap can be large and when to request a review.