
Town of Mount Royal: what February 2026 really reveals about your market
February 2026 reveals a market in transition: prices are holding, but selling times are soaring and buyers are more selective. Behind the apparent stability, the numbers show a market where patience is becoming essential

The February numbers confirm the story that has been taking shape for a few months now: TMR is a market in transition, where limited supply supports values, but where buyers are becoming more selective and some properties are struggling to find a buyer. Here is what the numbers reveal.
1. Sales: 7 transactions, a stable but misleading figure
In February 2026, TMR recorded 7 sales, exactly matching the February 2023 result and the historical low for this period. By comparison: 11 sales in 2021, 10 in 2022, 9 in 2024, and 7 in 2025. The five-year trend points to a slight contraction in volumes.
It is worth remembering that, in a market like TMR, 7 sales in a month do not necessarily mean a depressed market. Available inventory is naturally limited; there simply aren't hundreds of properties changing hands every month. Stable volumes can therefore reflect a lack of supply as much as a lack of demand.
What is certain: with 76 active listings in February 2026, there would have been room for more transactions had conditions allowed. The gap between available inventory and closed sales suggests that buyers have become more cautious.
2. Median selling time: 203 days, the market's strongest signal
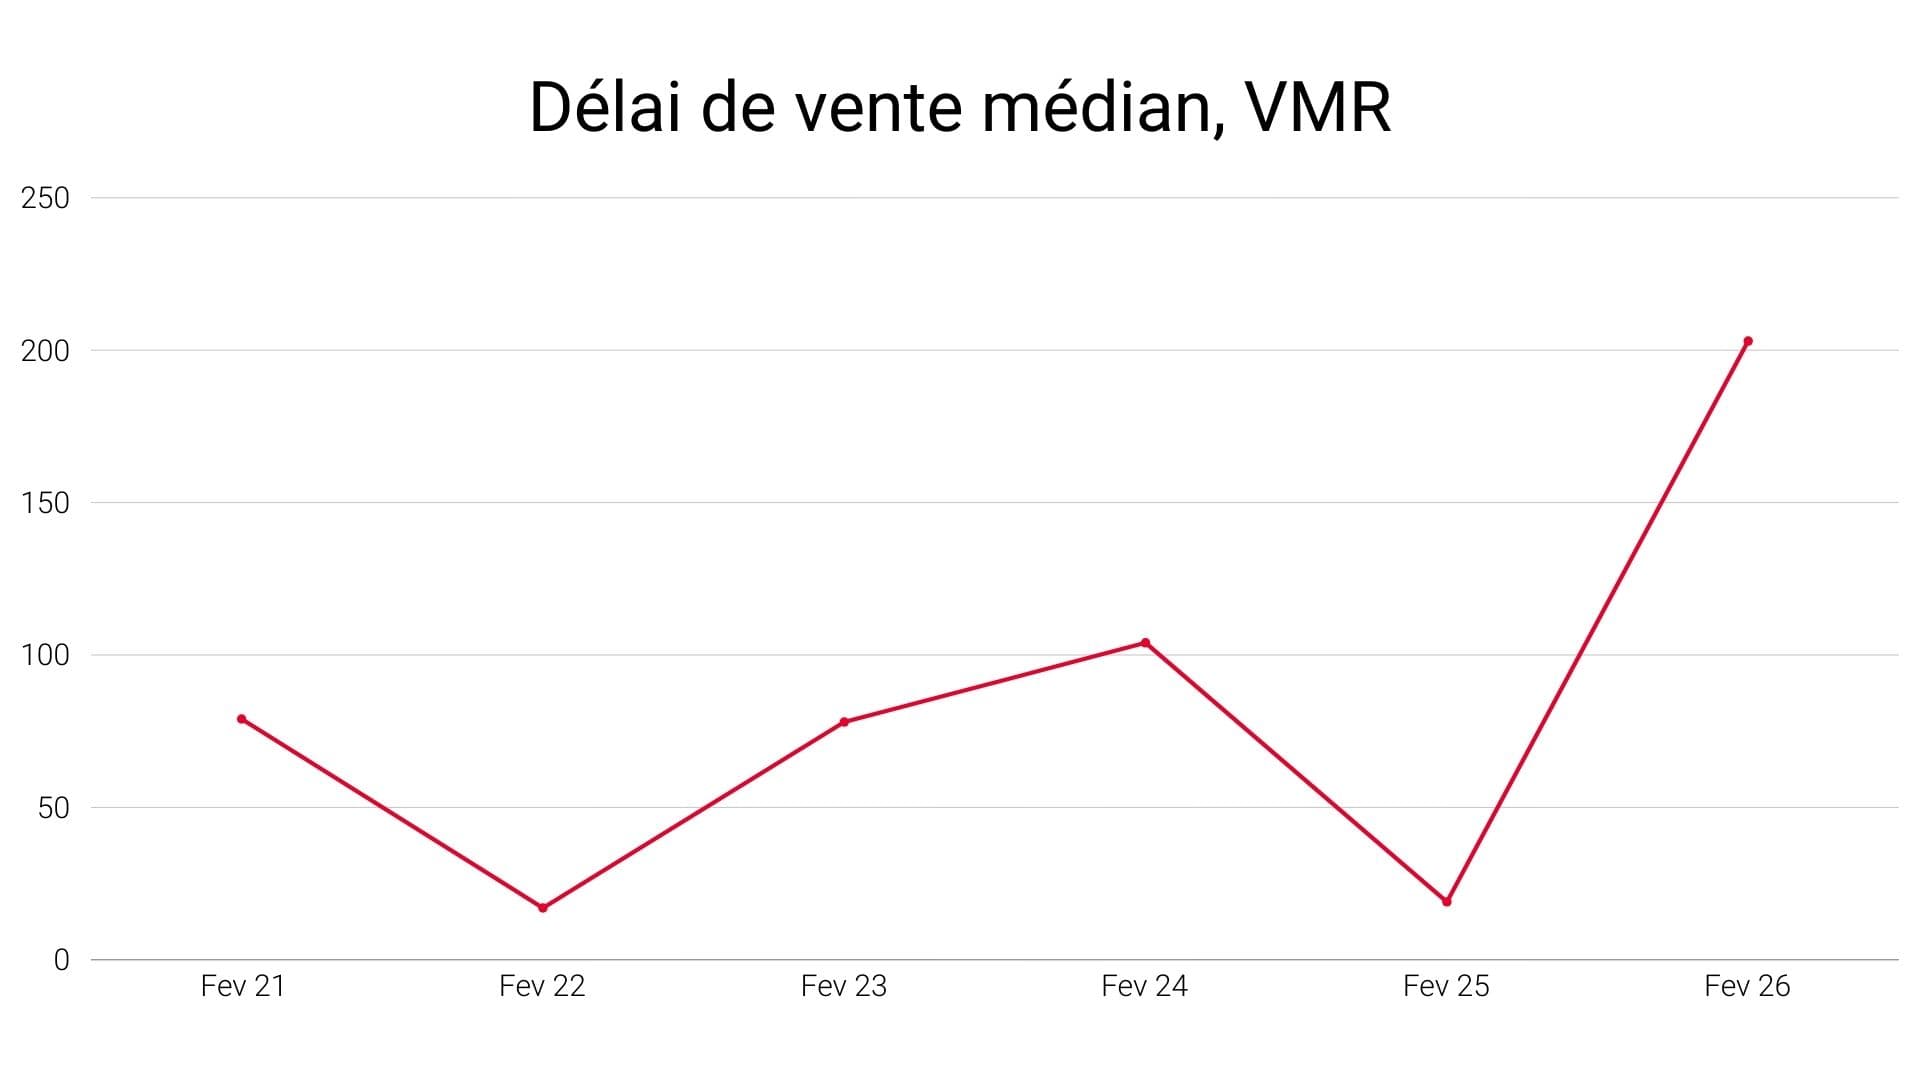
This is the most striking figure in this analysis: the median selling time in February 2026 reached 203 days, or nearly seven months. This is the highest level ever recorded for the month of February.
In February 2022, at the height of the post-pandemic frenzy, properties sold in a median of 17 days. In 2023, after the sharp rise in interest rates, that time jumped to 78 days. In 2024, it reached 104 days. In 2025, a statistical anomaly brought the figure down to just 19 days, most likely reflecting a very small number of transactions on properties that were already well positioned (recall, too, the successive interest rate cuts). And now, in 2026, it has reached 203 days.
What does this data tell us in concrete terms? Most of the properties that sold in February 2026 were put on the market in summer or fall 2025. They waited. Either because they were initially overpriced and required one or more price reductions, or because their profile (layout, location, condition) appealed to a particularly narrow pool of buyers.
This record selling time does not mean that all TMR properties are stagnating. In a low-volume market, a single property listed in July and sold in February can send the median soaring. It nonetheless confirms that a significant share of the inventory is struggling to find a buyer quickly.
3. Median prices: structural resilience at $1,650,000
The median sale price in February 2026 stands at $1,650,000. This figure is down from the peaks of 2021 ($2,280,000) and 2025 ($1,829,000), but it remains well above 2024 levels ($1,585,000). Above all, it holds well above the million-and-a-half mark. There is no linear trend, but rather the volatility typical of low-volume markets, where a handful of transactions can shift the median by several hundred thousand dollars.
What is significant is the absence of a price collapse. Despite lengthening selling times and increased buyer selectivity, TMR retains its fundamental value. The scarcity of available properties in this protected enclave, combined with the quality of life it offers, continues to attract a clientele that is not very sensitive to rate fluctuations.
4. Sale-to-original-price ratio at 93%: sellers holding firm
In February 2026, buyers paid on average 93% of the original asking price, a 7% discount from the list price. This is a modest negotiating margin, and it has been remarkably stable since 2023 (94% in 2023, 91% in 2024, 98% in 2025).
For comparison, recall that in February 2022 this ratio reached 100% — properties sold exactly at the asking price, or even above it in some cases (bidding wars). That bidding-war environment is now a thing of the past in TMR. But we are far from a market where sellers are forced into major concessions.
On properties with a median price of $1,650,000, a 7% gap represents roughly $115,000 to $120,000 of potential negotiation. For a buyer, that is substantial. For a seller, it is acceptable if the initial price was well calibrated. This ratio suggests that TMR sellers are not panicking: they are willing to negotiate a little, but they are not selling at a discount.
5. Active listings at 76: abundant supply... but relative
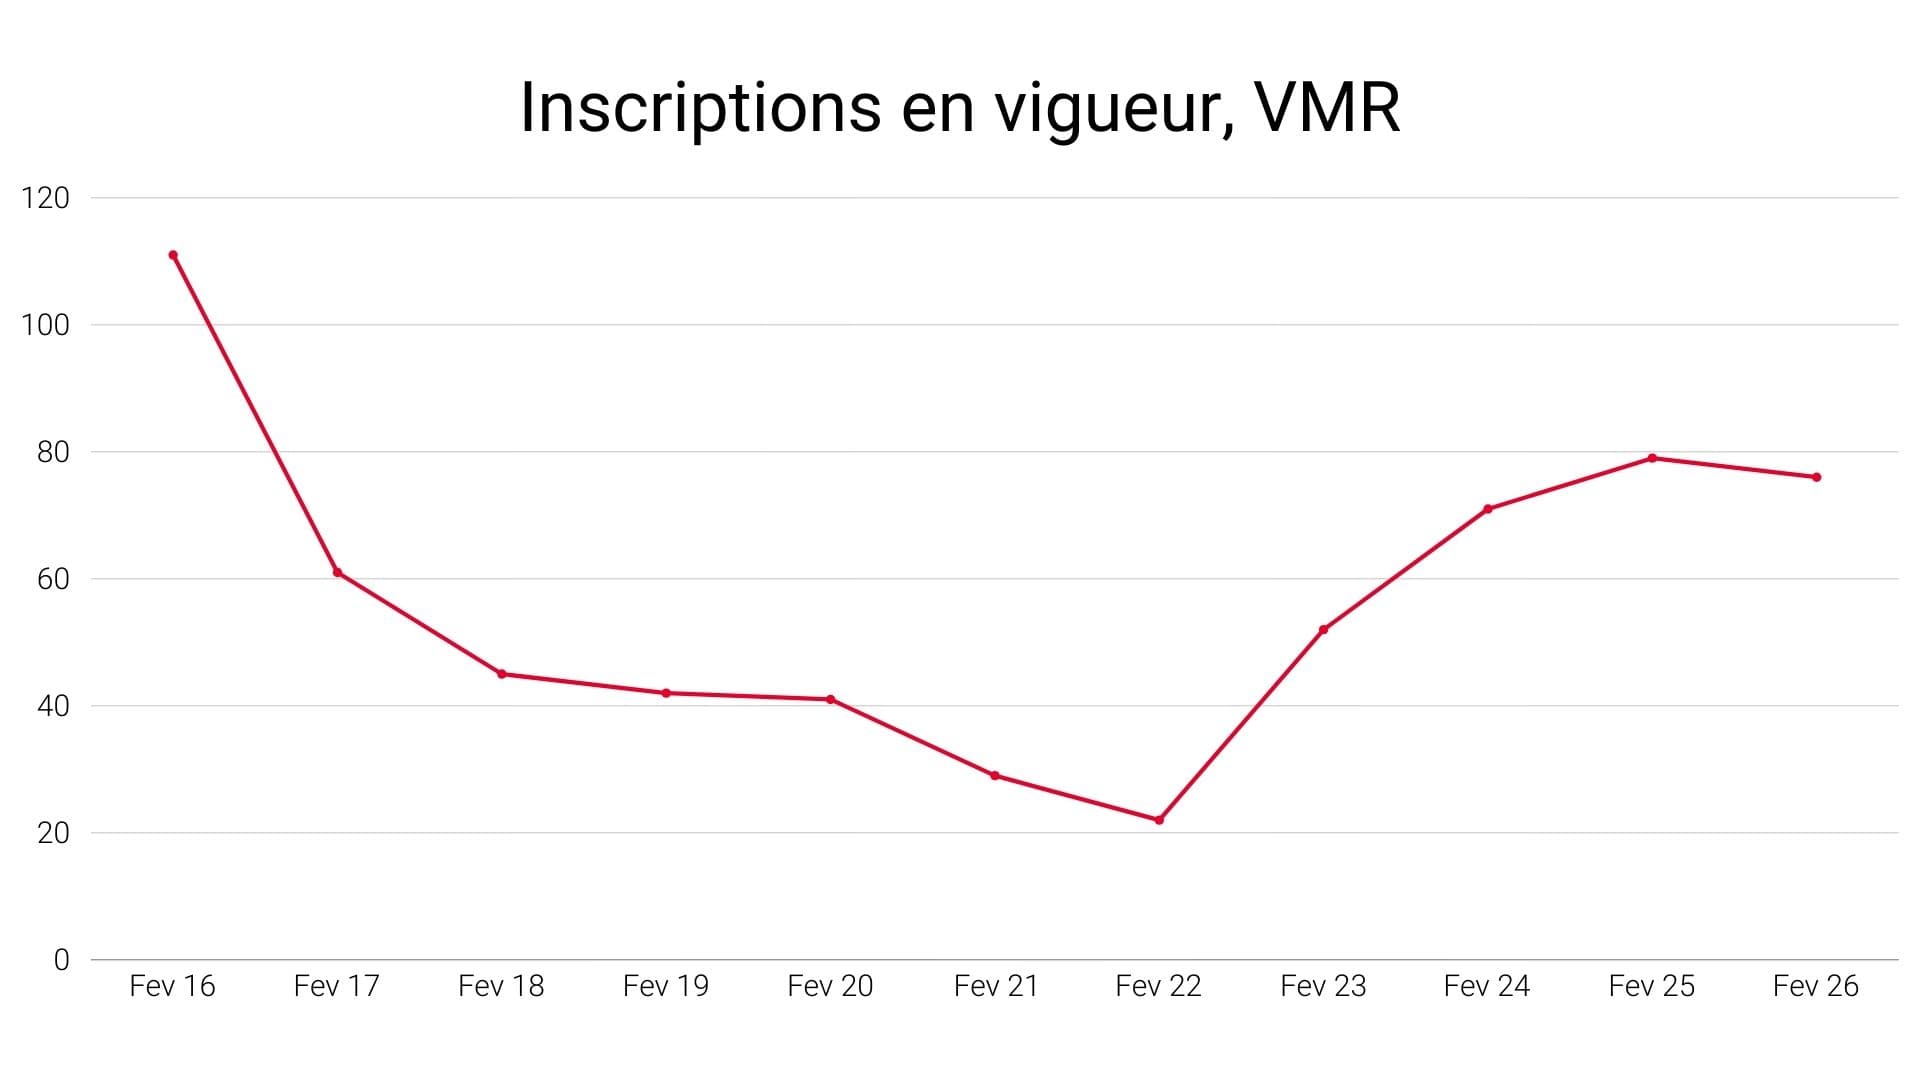
In February 2026, there were 76 active listings on the TMR market. This is the second-highest level since 2021, behind the 79 listings of February 2025. For comparison: there were only 22 in 2021 and 22 in 2022, years of low inventory and intense competition.
The increase in active listings since 2023 (52 properties) reflects a return of confidence on the seller side, or a need for some to sell despite a less favourable market. With 76 listings for 7 sales in a single month, the ratio speaks volumes: at the current pace, it would take about 11 months to sell off the existing inventory.
Abundant inventory combined with stable prices is the hallmark of prestige markets. TMR sellers generally have the means to wait. They are not forced to sell and would rather take their property off the market than let it go at a discount.
6. Expired listings at 12: the market's release valve
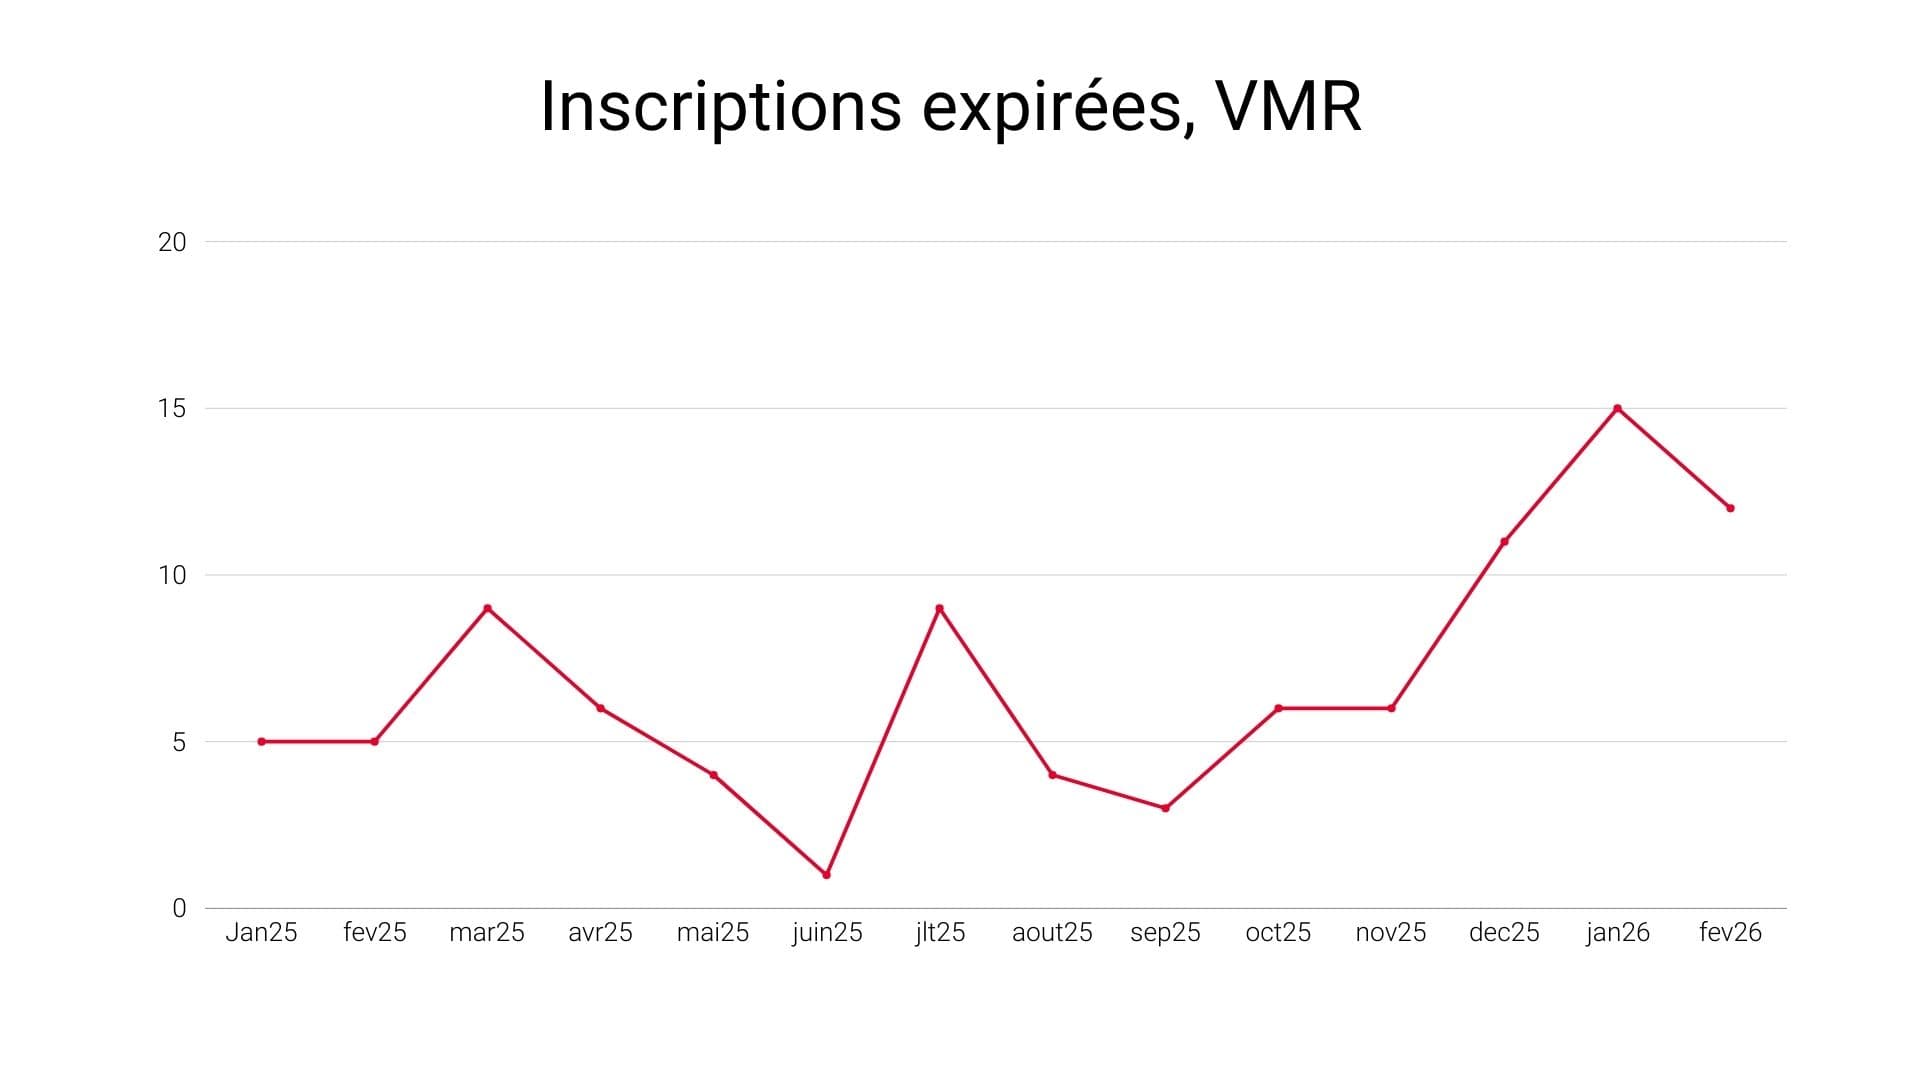
In February 2026, 12 listings expired without a sale, the highest level ever observed for this month in our records (0 in 2021, 0 in 2022, 8 in 2023, 5 in 2024, 5 in 2025). This data is crucial: it shows that sellers are prepared to take their properties off the market rather than accept a price they consider insufficient.
This behaviour is consistent with the other indicators. Long selling times, a moderate negotiation ratio and prices that are holding: everything indicates that TMR sellers are adopting a wait-and-see strategy. Some will relist their property in the spring, potentially with a revised pricing strategy. Others will wait for market conditions to improve.
7. Cross-analysis: what it all means together
A two-speed market. Some properties that are well positioned in terms of price, condition and location still sell quickly and close to the asking price. Others, often overpriced or in need of work, stay on the market for a long time, helping push the median selling time up to 203 days.
Scarcity supports prices despite apparent abundance. With 76 active listings but only 7 sales, one might expect a price correction. That is not the case, because TMR is a niche market where sellers are not compelled to sell.
February 2026 marks a departure from 2022. The golden era of a market with 17-day selling times and 100% of the asking price is well and truly over. The TMR market is returning to a certain normality, where buyers have more time to decide and more room to negotiate.
The signals for spring 2026. Historically, spring is the most active season in TMR. With inventory already high and several properties having expired in January and February, the spring season looks set to be busy on the supply side. If demand does not keep pace, notably because interest rates are still restrictive for some buyers, selling times could remain long.
Conclusion: TMR remains a market of value, but patience is required
February 2026 sends a clear message to sellers: the days of quick sales above the asking price are over. To succeed in this market, a property must be well showcased, correctly priced from the outset and supported by a professional who knows the nuances of this particular market. An overly ambitious pricing strategy leads straight to the expiry of the listing contract, as shown by the 12 listings that did not result in a sale this month.
For buyers, the current market offers more choice, a little more time to think and a modest but real negotiating margin. It is a rare window of opportunity to acquire a property in this sought-after area, before potentially more favourable rate conditions in 2026–2027 bring back more intense competition.
Source data: Centris / APCIQ — Town of Mount Royal, January 2021 to February 2026. Analysis based on six indicators: sales (number), median sale price, median selling time, active listings, expired listings and sale-price-to-original-price ratio.
Need help interpreting the market for your project?
Our team can help you understand what this data actually means for your project.
Related content

Inventory Drops and Buyers Return in TMR. But for How Long?
At the end of 2025, inventory in the Town of Mount Royal (Ville Mont-Royal) fell from 110+ to about 60 properties, creating an unexpected scarcity. The real verdict will come in the spring.

Selling a house in the Town of Mount Royal in 2026: the owner's strategic guide
Selling a house in the Town of Mount Royal isn't quite like selling anywhere else in Montréal.

Why TMR Market Requires Patience and Precision
The TMR market remains resilient: despite longer selling times, prices have remained stable due to the limited supply of available properties. In a more uncertain economic environment, buyers are taking more time to make decisions.